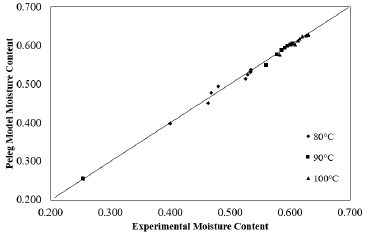
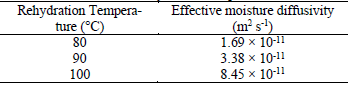
Abstract-- In the present research, it was aimed to understand the effect of different rehydration temperatures (80, 90 and 100°C) on rehydration kinetics of hot air dried chicken breast meat cubes. The rehydration rate increased with the increasing of temperature of rehydration water. ΔE and chroma values of the rehydrated samples at 90°C and 100°C samples were found statistically similar. To describe the rehydration kinetics, four different models, Peleg’s, Weibull, first order and exponential association, were considered. Between these four models proposed Peleg’s model gave a better fit for all rehydration conditions applied. The effective moisture diffusivity values of chicken meat increased as water rehydration temperature increased.
Keywords-- Chicken breast meat; Rehydration; Kinetic; Color; Modeling.
I. INTRODUCTION
Like other animal origin foods, chicken meat shows superior nutritious properties in terms of high biological value protein, polyunsaturated fatty acid, significant amount of vitamins from group B and minerals especially iron and zinc (Barroeta, 2007; Milicevic et al., 2014). Also, chicken meat is the cheapest and the most accessible meat source in recent years (Yıldırım and Ceylan, 2008). However, the chicken meat is very perishable to microbiological spoilage. So, the various techniques (drying, curing, canning, etc.) are applied both extend in order to shelf-life and to increase product range in chicken market (Babic et al., 2009). Drying is one of the efficient ways that improve the safety of food with regard to microbiological and chemical stability (Feng and Tang, 1998). Drying is an essential step to produce fermented, cured and powdered meat products. Dried chicken meat is used as an ingredient to various ready-to-eat foods such as soup, pizza, noodles, etc. (Başlar et al., 2014). However, the drying process generally can negatively affect the quality (loss of nutrients, color, texture, flavor, etc.) of the final product (Scala and Crapiste, 2008). So, rehydration is carried out to improve physical properties of dried product. Rehydration is a complex process used for restoration of dried foods treated with water (Falada and Abbo, 2007). The ability of a dried food material to rehydrate, or return to original weight when immersed in water, depends on its physical structure as well as its chemical properties (Farkas and Singh, 1991).
Many studies have been carried out dealing with rehydration of foods such as amaranth leaves (Mujaffar and Loy, 2016), broccoli floret (Sanjuan et al., 2001), strawberry (Meda and Rati, 2005), red bell pepper (Vega-Galvez et al., 2008), grapefruit (Martinez-Navarrate et al., 2019), pumpkin slices (Benseddik et al., 2019), as well as chicken meat (Schmidt et al., 2009), chicken breast meat (Mounir, 2015), chicken powder (Ran et al., 2018), chicken cubes (Shiby et al., 2015).
The aim of this study was to investigate, rehydration kinetics of the dried chicken meat (50°C) at 80, 90 and 100°C and with two empirical models which are Peleg and Weibull. The empirical models described the rehydration process properly. In addition, color parameters (L*, a* and b*) were analyzed during rehydration process.
II. METHODS
A. Material
In this study, boneless and skinless fresh chicken breast meat was used which were obtained from a local poultry meat processing plant (Gedik Pilic Co.) in Usak, Turkey and it was transported to the laboratory in ice boxes and stored at 4°C until use.
B. Drying Process
Each of the drying process, 75±2 g chicken breast meat was used. They were cut in slices of 1 mm thickness, 1 mm of diameter and 1 mm of length with a sharp knife. Sliced samples were placed to the drying trays and then were carried out in a cabinet laboratory type drier at 50°C installed in the Food Engineering Department of Pamukkale University, Turkey. The dryer consists of a centrifugal fan to supply the air flow, an electric heater, and an electronic proportional controller (ENDA, EUC442, Istanbul, Turkey). The cabinet included four removable trays of 40 × 60 cm, which are made of stainless-steel gauze formed into a fine sieve.
During the drying process, after the samples were taken from the dryer at 30 min intervals, and weighed. The weight of the samples was measured using an analytical digital balance (model TP-3002, Denver Instruments, Gottingen, Germany). Drying experiments were carried out at a constant air velocity of 0.2 m/s and a constant relative humidity of 20% until targeted %35 final moisture content. The experimental results are expressed as mean ± standard deviation of duplicate measurements and the results were processed using Microsoft Excel.
C. Rehydration
Rehydration processes were carried out at three different temperatures (80, 90 and 100 ºC) in distilled water. A water bath (WB-11 Model, Wisd Laboratory Instruments, Wertheim, Germany) was used for rehydration process. Before the rehydration process beginning, the temperature of the water bath was set according to the required rehydration temperature (80, 90 and 100 ºC). Glass containers were placed in water bath. Afterwards, 150 ml of distilled water was added to glass containers with 250 ml capacity and it was checked whether the temperature of the distilled water in the glass container reached the desired working temperature with the aid of a thermometer. Approximately, 8±0.50 g the dried sample was rehydrated by immersion in 150 mL of distilled water (80, 90 and 100 ºC) and the evaluation of sample moisture over the time was determined by mass balance. At 30 min intervals, the samples taken from water bath superficially dried with paper towel to remove superficial water on the surface and weighed. The rehydration process was stopped when the weight of the samples stabilized. The weights of samples were measured with an analytical digital balance (model TP-3002, Denver Instruments, Gottingen, Germany) having a sensitivity of 0.01 g. Each rehydration experiment was performed by duplicate.
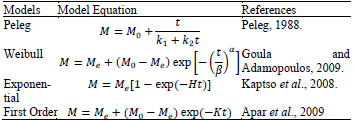
Table 1. Mathematical
models applied to rehydration curves of dried chicken meat cubes.
D. Rehydration kinetics modeling
During three different rehydration temperature (80, 90 and 100°C), rehydration kinetic models of the dried chicken breast meat were evaluated using appropriated mathematical models. The rehydration models used commonly in literature are given in Table 1. The Peleg model, consists of two parameter equation generally used in rehydration of many dried foods (Dadali et al., 2008; Goula and Adamopoulos, 2009; Bilbao-Sainz et al., 2005; Planinic et al., 2005).
 is the initial moisture content
expressed as dry basis [(kg water) (kg dm)−1] and
is the initial moisture content
expressed as dry basis [(kg water) (kg dm)−1] and  is the moisture content at any time [(kg
water) (kg dm)−1].
is the moisture content at any time [(kg
water) (kg dm)−1].  is the rehydration time (min),
  is the Peleg rate constant (min [(kg
water) (kg dm)−1)],
is the Peleg rate constant (min [(kg
water) (kg dm)−1)],  is the Peleg capacity constant [(kg
water) (kg dm)−1] (Peleg, 1988). If the time of rehydration is
long enough, the equilibrium moisture content (
is the Peleg capacity constant [(kg
water) (kg dm)−1] (Peleg, 1988). If the time of rehydration is
long enough, the equilibrium moisture content ( ) [(kg water)(kg dm)−1]
is given in Table 1.
) [(kg water)(kg dm)−1]
is given in Table 1.
In the
literature, many researchers accepted that the Weibull model is the most
suitable model to explain the rehydration behaviors of dried foods among other
rehydration models (Diaz et al., 2003; Garcia-Pascual et al., 2006;
Marquez et al., 2009).  is the shape parameter,
  is the rate parameter,
  is the moisture content at time
  . is the initial moisture content, and is the equilibrium moisture content.
  is the rehydration kinetic constant (min−1) and
  is the rehydration kinetic constant (min−1).
Diffusion, observed during drying of foods and rehydration of dried foods is a complex phenomenon. While a rapid mass transfer occurred at the beginning of the drying and rehydration process, the rate of mass transfer decreased towards the end of the process. Consequently, the diffusion of water decreased (Resio et al., 2006; Markowski et al., 2009).
The
effective diffusivity coefficients ( ), depending on the temperature during rehydration, are calculated
by using the Fick’s second law (Markowski et al., 2009; Kaymak-Ertekin,
2002). Some assumptions were made in this law.
), depending on the temperature during rehydration, are calculated
by using the Fick’s second law (Markowski et al., 2009; Kaymak-Ertekin,
2002). Some assumptions were made in this law.
• The initial moisture content of rehydrated sample is uniform.
• During the rehydration, the food protects original shape.
• Moisture intake from the food surface begins by immersing the food in the rehydration medium.
• Heat and mass transfers are neglected factors that will be outside the conditions specified for rehydration.
• The effective diffusivity coefficient is constant during the rehydration.
• Volumetric changes of rehydrated food are neglected throughout the rehydration (Maldonado et al., 2010).
Accordingly, the effective diffusivity coefficients of the dried chicken breast meat (at 50°C) slices during the different rehydration temperatures are used in Eq. (1).

is explained as effective moisture diffusivities (m2s-1)
and is the moisture content at any time [(kg water) (kg dm)−1].
 expresses the initial moisture content non-rehydration expressed
[(kg water) (kg dm)−1,
expresses the initial moisture content non-rehydration expressed
[(kg water) (kg dm)−1,  is equilibrium moisture content (kg water/kg dm),
  is non-dimensional moisture content/amount, is rehydration time (min),
  is the half-thickness of the used samples (m) (Tütüncü and Labuza,
1996).
is the half-thickness of the used samples (m) (Tütüncü and Labuza,
1996).
The
slope ( ) is calculated using Eq. (1) when the time-varying graphs of the
amount of dimensionless moisture calculated for dried chicken breast slices rehydrated
in three different temperatures are plotted to have semi logarithmic coordinates.
) is calculated using Eq. (1) when the time-varying graphs of the
amount of dimensionless moisture calculated for dried chicken breast slices rehydrated
in three different temperatures are plotted to have semi logarithmic coordinates.

In the study, the effective diffusivity coefficients with the rehydration process at three different temperatures were calculated using the slopes.
E. Color measurement
The color
values of samples were performed with colorimeter (Hunterlab Miniscan XE Plus,
USA). Before each session the colorimeter (aperture size of 25mm) was
calibrated on the CIE color space system using a black and white tile. The L*
value indicates lightness (L* = 0 darkness, L* = 100 lightness); a* value indicates
redness (+ 60 = red, − 60 = green) and b* value indicates yellowness (+
60 = yellow, − 60 = blue). Color measurements were taken at room
temperature with illuminant D65 and a 0°
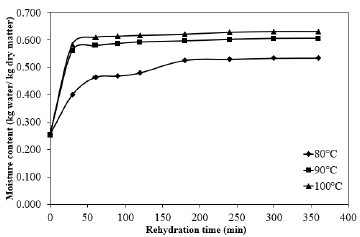
Figure 1. Time versus weight of slices of rehydrated chicken meat at three different temperatures (80, 90 and 100°C).
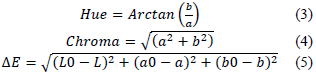
angle observer on the outer surface of chicken breast meat from randomly chosen regions of the meat. Hue angle (°), Chroma, and total color difference (ΔE) of dried chicken cubes were calculated as given in Eq. 3 through Eq. 5 (Topuz et al., 2009).
F. Statistical analysis
Compliance with the
experimental rehydration curves of the rehydration models used in the study
were determined by nonlinear regression analysis using Microsoft Excel
(Microsoft Office, version 2013) program. To evaluate the goodness of each
model fit, the coefficient of determination, R2, root mean square
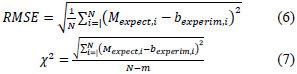
error ( ) and chi-square (χ2) values were calculated using
Eq. (6) and (7) (Sacilik et al., 2006).
) and chi-square (χ2) values were calculated using
Eq. (6) and (7) (Sacilik et al., 2006).
 (7)
(7)
III. RESULTS
A. Rehydration process and color value
Dried chicken breast meat cubes were rehydrated at three different rehydration temperature (80, 90 and 100°C), to investigate the effect of rehydration temperature on rehydration kinetics of dried meat cubes. During the rehydration process, water absorption of the samples performed. During the rehydration process lasting 6 hours, the moisture content of the samples increased from 0.255 to 0.606±0.05 kg water/kg dry matter. Results of the moisture content (kg) with rehydration time (min) are obtained for each set of temperatures are given in Fig. 1.
The temperatures of water used for rehydration pro-cess have significant effect on water absorption of the samples. As can be seen from Fig. 2, the rehydration rate increased with the increasing of temperature of rehydration water. Moreover; while the rehydration rate found fairly high at the initial stage of the rehydration process, followed by a slower absorption rate in the final stage of the process. This typical rehydration behavior was observed by many researchers. For example, Muñoz et al. (2012) was to study the rehydration kinetics at two temperatures (5 and 15 °C) of salted ground pork, (2% or 4% NaCl) dried to different water contents, (10%, 20% and 35%) and they stated that the rehydration rate of samples increased with the increasing of salt concentration however, weight of samples rapidly increased at the beginning of the rehydration process. And also, they determined that rehydration was faster at 15°C than at 5°C.
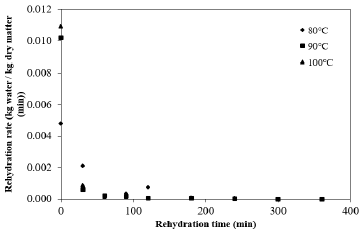
Figure 2. Time versus rehydration rate of slices of rehydrated chicken meat at three different temperatures (80, 90 and 100°C).
Color is one of the most important quality characteristics of foods in terms of consumer acceptance. However, several physicochemical reactions occurred in foods associated with color changes. When protein fraction of the chicken meat exposed to heat during drying process, the color changes could be attributed to denaturation of myoglobin to metmyoglobin and Maillard browning reactions. The color values of slices of chicken breast meat dried and rehydrated at 50°C are given in Table 2. The L* values of dried chicken meat cubes varied with different rehydration temperature (p<0.05), where re-hydrated at 90°C samples had significantly higher L* values, while rehydrated at 80°C samples had the low-est L* values (Table 2). Rehydrated at 90°C samples had obviously higher a* and b* values than the other samples. In terms of the a* values, no significant differences were observed rehydrated at 80°C and 100°C samples (p>0.05). Moreover, b* values of rehydrated at 90°C and 100°C samples were not significantly differences (p>0.05). A decrease in L* value and increase in a* value indicated both increase of browning discoloration and oxidation reaction.
ΔE and chroma values of the rehydrated samples at 90°C and 100°C samples were found statistically similar (p>0.05), rehydrated at 80°C samples were lower than the other samples (p<0.05). In terms of hue angle, all the samples were significantly different (p<0.05). In a study, microwave-dried amaranth leaves rehydrated at three different temperatures (35, 50, and 60°C) and the color difference (ΔE) between fresh leaves and leaves rehydrated at 35°C was found significantly higher than other samples (Mujaffar and Loy, 2016).