HYDRODYNAMICS
IN A TWO-COMPARTMENT BIOREACTOR
E.B. DE JESUS† , L.R.P. DE ANDRADE
LIMA†, L.A. BERNARDEZ‡ and P.F. ALMEIDA‡
†Department
of Materials Science and Technology, Federal University of Bahia, Rua Aristides
Novis, 2, Salvador, Bahia, Brazil CEP 40210-630. E-mail: ebjesus@ufba.br, lelo@ufba.br
‡Industrial
Engineering Graduate Program, Federal University of Bahia, Rua Aristides Novis,
2, Salvador, Bahia, Brazil CEP 40210-630. E-mail: leticiab@ufba.br, pfa@ufba.br
Cite this arcicle as:
E.B. DE JESUS, L.R.P. DE ANDRADE LIMA, L.A. BERNARDEZ and P.F.
ALMEIDA (2017) “HYDRODYNAMICS IN A
TWO-COMPARTMENT BIOREACTOR”, Latin American Applied Research, 47(1), pp 23-28.
Abstract-- Upflow two-compartment packing-free/packed-bed bioreactors
have been used in petroleum microbiology due to their similarity with the oil
field close to the injection or production wells. This two-compartment
configuration gives a particular hydrodynamics to the liquid phase. In this
study the hydrodynamics of a pilot reactor filled with glass beads was
studied using tracer experiments. The residence time distribution was
calculated and interpreted. The results for interstitial Reynolds number (ReLi
<0.3) show curves with a peak at the beginning and a long tail that is
distorted by the solution flow rate. A model composed of a continuous stirred
tank, plug flow and cross-flow reactors was used to describe the flow patterns.
Keywords-- Hydrodynamic, Packed-bed reactor, Residence time distribution.
I. INTRODUCTION
Petroleum microbiology investigate bacteria isolation, identification, growth and inhibition focus on the oil recovery enhancement or depletion, in addition to the souring control, which is a major problem to the oil industry (Ollivier and Magot, 2005; Callbeck et al., 2011; Bernardez et al., 2012). The most used bioreactors for petroleum microbiology studies are upflow packed-bed reactors due to their large surface area for the attachment of microorganisms and reduced bioreaction time. However, to simulate the oil field close to the injection or production wells these reactors operate at low flow-rate and should have a large empty space at the entrance. This two-compartment configuration gives a particular hydrodynamic behavior to this bioreactor and simulates the oil wall injection region, where the sulfate reducing bacteria are most concentrated in an oil field (Ollivier and Magot, 2005).
Previous results of tracer experiments for upflow packed-bed reactors showed that their hydrodynamic behavior is close to the ideal plug-flow, but in most cases there is a significant axial dispersion and exchange with a stagnant zone. The liquid axial dispersion and holdup for packed-bed reactors can be correlated with the liquid flow rate using the superficial (ReLi=udprL/mL) or interstitial (ReLi=udprL/emL) Reynolds numbers, where u is the superficial velocity of the liquid phase (u=QL/S)), dp is the average size of the solid particles in the reactor bed, rL is the density of the liquid, mL is the viscosity, e is the bed porosity, QL is the liquid flow rate, and S is the cross section area of the porous bed (Backer and Baron, 1994; Bayraktar and Mehmetoglu, 2001; Méndez-Romero et al., 2011; Bernardez et al., 2008).
The hydrodynamics of an one-compartment upflow bioreactor was presented recently (Bernardez et al., 2008). The liquid flow rates used were 2.6, 14.5 and 34.5 mL/min, which corresponds to interstitial Reynolds numbers for the liquid phase of 0.096, 0.52 and 1.26. The results showed that at high flow rates the reactor behaves predominantly like a plug-flow reactor which is distorted by the presence of small axial dispersion and an interaction with a stagnant zone, and at low flow rates both the dispersion and the interaction with a stagnant zone are significant. In addition, there is by-passing at low and intermediate flow rates. In this case the average residence time of the solution was close to the nominal residence time. A similar behavior was observed by Mendez-Romero et al. (2011) to evaluate a packed bed reactor filled with rock fragments.
Recently the hydrodynamics of a two-compartment bioreactor was addressed and phenomenological models for the two zones, that included an exchange between dynamic and stagnant regions, bypass and stirred-tank reactor was used to fit the residence time distribution curves (Iliuta et al., 2015). This bioreactor has some similarity with the reactor presented in this study; however, it is a two compartment packing-free/packed-bed bioreactor instead of a packed-bed/packing-free bioreactor.
The bioreactor presented in this study differs from the others because present a lower compartment empty of porous bed, which mimics the space due to the well in an oil field. This feature gives the bioreactor a standard feature of flow that must be considered, mainly because the region of interest of microbiological processes involving bacteria occurs in the vicinity of water injection wells.
The arrangement of ideal reactors
(continuous stirred and plug flow) is the simplest approach to describe the
hydrodynamics of non-ideal reactors. The reactor configuration and the
parameters of the models can be estimated using a curve fit method based on a
least-square criterion which is minimized with respect to the model parameters.
This solution does not involve a strict phenomenological model or differential
equation, but it gives insights into the phenomenology which can help the
further elaboration of phenomenological models. The details of the residence
time distribution (RTD) calculations used in this work were previously
described (de Andrade
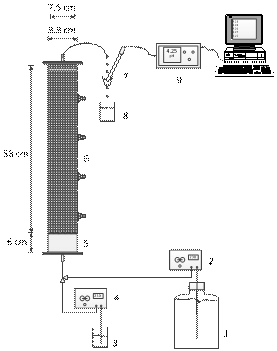
Figure 1.
Schematic representation of the experimental setup used in the column residence
time distribution studies. The numbers stand for: 1) distilled water reservoir,
2) constant flow high pressure pump, 3) tracer reservoir, 4)
constant flow high pressure pump, 5) the
reactor bottom empty compartment, 6) the reactor porous bed, 7) small
tank with a hole in the bottom and pH electrode, 8) waste solution reservoir,
9) pH meter, and 10) computer.
The main objective of this study is to describe the hydrodynamic
behavior of a pilot-scale upflow packed-bed bioreactor that has two
compartments (a porous bed and a bottom reservoir) and operates at low Reynolds
numbers (ReLi<0.3).
II. MATERIALS AND METHODS
Figure 1 shows the schematics of the experimental setup used in the present study. It consists of an 8.8 cm internal diameter, 64.0 cm high packed column that is a super-duplex stainless steel cylindrical bioreactor that has four lateral sampling ports, closed with high pressure vanes. The distance between the sampling ports is 14.0 cm. The upper zone of the reactor, which consists of an 8.8 cm internal diameter, 58.0 cm high, was filled with 3.0 mm glass beads, which gives a bed porosity of 40 %. The bottom of the reactor has an empty space measuring 7.5 cm in internal diameter, and 6.0 cm high. Separating these compartments there is a one millimeter thick plate with holes of one millimeter of diameter that supports the packed-bed. Distilled water was introduced at the bottom of the column by a dual piston constant flow HPLC pump and a PTFE-tubing (polytetrafluorethylene), and collected at the top of the column.
The injection of distilled water and
the tracer (sulfuric acid) was done with two independent HPLC pumps (see Fig.
1). The liquid solution was
collected in a small reservoir with a small hole in the bottom, which retained
a small volume of the solution and enabled the measurement of pH using the
Marconi pHmeter, model PA 200. The pH measured as a function of time was read
by a personal computer and ASCII (American Standard Code for Information
Interchange) files were used to perform the subsequent analysis. The measured pH
was used to evaluate the tracer concentrations. Before starting the
experiments, distilled water was injected into the reactor to saturate the bed.
After each experiment, the bed was continuously
rinsed with distilled water to assure that the tracer was removed and to assure
steady state condition in the flow rate. All experiments were conducted at room
temperature and atmospheric pressure. The hydrodynamic behavior of the reactor
was studied for the liquid flow rates equal to 2.6, 3.5, 5.0, 7.5, 10.0, and
12.0 mL/min. The interstitial Reynolds numbers for the liquid phase are: 0.05,
0.08, 0.11, 0.16, 0.22, and 0.26 respectively.
The calculations related to the treatment of the acquired
pH data and the calculation of the residence time distributions were done using
in-house code developed using MATLAB v.7 (from MathWorks Inc).
III.
RESULTS AND DISCUSSIONS
The
hydrogen ion concentration in the solution as a function of time was calculated
from the pH values ([H+] = 10-pH). The residence time
distribution E(t) and the average residence time (![]() ) were calculated as described in previous studies (de
Andrade
) were calculated as described in previous studies (de
Andrade
Figure 2 shows the results of input-output response tests and relates the variation of the H+ ion concentration with time for the flow rates equal to 2.5, 5.0 and 12.0 mL/min. The reproducibility of the distributions was assessed with the repetition of five of the six operating conditions tested. The plots show that the distributions are reproduced in the initial region of the curve and that there is variable behavior at the end of the curves. The presence of an initial peak followed by an exponential decay function is a characteristic behavior of packed-bed reactors. At low flow rates the reactor exhibits a similar hydrodynamic pattern to plug-flow reactors distorted by the presence of strong axial dispersion and the presence of stagnant zones. At intermediate flow rates the axial dispersion and stagnation zones are reduced. At high flow rates the axial dispersion and stagnation zones are small and the presence of preferential flow channels is noted. In all cases, the delay in the output of the tracer may be related to the reactor water inlet and outlet systems which are composed of pipes, valves and a small reservoir for the pH electrode. Since the zones of stagnation and preferential flow paths may be related to the existence of a void at the bottom of the reactor, this may result in the retention of some of the tracer, releasing it slowly over time. This characteristic may explain the hydrodynamic behavior of the difference between the rated reactor and those studied by Bernardez et al. (2008) and Méndez-Romero et al. (2011).
The nominal residence time of the solution in the reactor can be calculated from the actual volume of the reactor and the solution flow rate. In the present case the volume of the reactor is given by the volume of the porous bed plus the volume of the empty compartment located at the bottom. The total reactor volume in liters is:
![]() (1)
(1)
where the db
is the diameter of the reactor bed, hb
is the length of the reactor bed, dr
is the diameter of the reactor empty compartment, hr is the length
of the reactor empty compartment, and e is the bed porosity.
It can be seen that the empty compartment located at the bottom of the reactor
houses 15.8% of the actual volume of the reactor. The nominal residence time in
hours is given by:
![]() , (2)
, (2)
where the QL
is the solution flow rate in mL/min.
(a)

(b)

(c)

Figure 2. Reactor impulse response for
different flow rates (mL/min): a) 2.5, b) 5.0, c) 12.0.
(a)

(b)

Figure 3. a)
Average and nominal solution residence time as a function of the solution flow
rate. b) The deviation from the plug-flow behavior of the solution residence
time as a function of the solution flow rate.
Figure 3a shows the nominal and the measured average residence times for the reactor as a function of the flow rates. The correlation between the average residence time and flow rate is given by:
![]() , (3)
, (3)
It
is interesting to note that ![]() and tn decrease with the flow rate enhancement; however, the average residence
time curve is higher than the actual nominal residence time which indicates the
presence of stagnant and mixing zones. These results are different from those
seen by Bernardez et al. (2008) and
Mendez-Romero et al. (2011) who
observed similarity between
and tn decrease with the flow rate enhancement; however, the average residence
time curve is higher than the actual nominal residence time which indicates the
presence of stagnant and mixing zones. These results are different from those
seen by Bernardez et al. (2008) and
Mendez-Romero et al. (2011) who
observed similarity between ![]() and tn. Figure 3b shows the evolution of the difference between the
average and nominal residence time with the flow rate. It is evident that the
flow rate enhancement reduces the mixing and the exchange with the stagnant
zones and the hydrodynamics become closer to plug flow behavior.
and tn. Figure 3b shows the evolution of the difference between the
average and nominal residence time with the flow rate. It is evident that the
flow rate enhancement reduces the mixing and the exchange with the stagnant
zones and the hydrodynamics become closer to plug flow behavior.
Figure 4 shows the relationship between the ratio of the nominal residence time and the average residence time (Q = tn/t) as a function of the interstitial Reynolds number. The plot shows that as the Reynolds number increases, the Q also increases, which causes a reduction in the average residence time associated with the reduction in the stagnation zones. The correlation between the ratio of the nominal residence time and the average residence time as a function of the interstitial Reynolds number in the present case is given by:
![]() , (4)
, (4)
To model the reactor, an arrangement of simple ideal reactors
was used. A large number of combinations were evaluated to represent the
different hydrodynamic behavior of the reactor and the results shown here are
those with the best fit with a limited number of parameters. Figure 5 presents
a generic scheme of the arrangement of CSTRs and CSTRs with exchange with a stagnant
zone, which describes the hydrodynamic behavior of the upflow packed-bed
reactor. In this superstructure K, L, M, and N stand for the number of reactors
in the cascade of each branch and α
and β stand for the fractions of
flow rate directed to each branch of the arrangement.
Figures 6a, 6b and 6c show the
experimental and the calculated data fitted with the superstructure (Fig. 5),
for 2.5, 7.5, and 12.0 mL/min. The main features of the curves are well
represented by the generic hydrodynamic model (Fig. 5).
Figures 7a to 7e summarize the
relationship between the volumes of the elements of the model that compose the
reactor for different flow rates. At low flow rate (Figs. 7a and 7b) the model is
described by a PFR in series with a CSTR with active and dead zones and a cascade
of CSTRs.
In both cases (Figs. 7a and 7b), most of the hydrodynamic
behavior of the reactor is explained by the active zone of the CSTR followed by
the exchange with the stagnant zone, probably related with the reactor res ervoir
at the bottom and the interaction with the stagnant liquid found around the
glass beads. The PFR component is explained by the pipes and the reactor entrance
and exit. The CSTR cascade, which increases with the flow rate, seems to be
related to the solid bed axial dispersion.
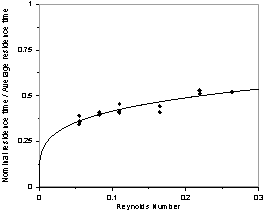
Figure 4. The ratio nominal to average solution residence
time (Q = tm/t) as
a function of the interstitial Reynolds number.
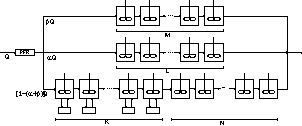
Figure 5. Generic process flow diagram to the
two-compartment
packing-free/packed-bed.
(a)

(b)

(c)

Figure 6. Experimental and fitted (dash line) residence
time distribution as a function of the solution flow rate (in mL/min): a) 2.5, b) 7.5,
and c) 12.
At intermediate flow rate (Figs. 7c and 7d) the hydrodynamic model is described by a PFR in series with two parallel branches. In the main branch there is a CSTR with active and dead zones in series with a cascade of CSTRs. In the secondary branch, there is a cascade of CSTRs that account for a small fraction of the reactor volume. The main components are analogous to the previous case, but the secondary branch is a bypass caused by the direct flow of the liquid without interact tion with the stagnant liquid found at the bottom reservoir or associated with the glass beads.

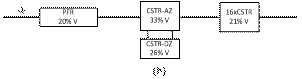

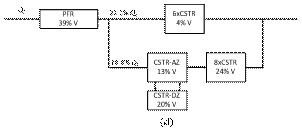
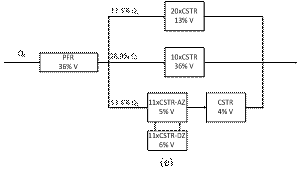
Figure 7. Hydrodynamic models for the two-compartment packing-free/packed-bed reactor as a function of the solution flow rate (in
mL/min): a) 2.5, b) 5, c) 7.5,
d) 10, and e) 12.
At high flow rate (Fig. 7e) the hydrodynamic model is described by a PFR in series with three parallel branches. In the main branch there is a CSTR with active and dead zones in series with a cascade of CSTRs. In the secondary branches, there are cascades of CSTRs that account for most of the reactor volume. The main components are analogous to the previous case, but the secondary branches are bypasses of liquid flow with axial dispersion through the solid bed.
The results are consistent with those presented by Iliuta et al. (2015) who used a CSTR with active and dead zones for modeling of the residence time distribution of the liquid phase in the packing-free region in a two-compartment packed-bed/packing-free bioreactor.
IV. CONCLUSIONS
The residence time distribution of the liquid phase in an
upflow two-compartment packing-free/packed-bed reactor was evaluated using
tracer experiments. A schematic model of a continuous stirred tank, plug flow
and cross-flow reactors was used to describe the flow patterns. The results for
flow rates ranging from 2.5 to 12.0 mL/min show non-ideal behavior with
variable axial dispersion, bypassing and stagnant zones. The axial dispersion is reduced with
increasing flow rate. For low flow rates (2.5 and 5.0 mL/min) no bypassing was
detected and the presence of strong axial dispersion and a small interaction
with a stagnant zone occurred. For intermediate flow rates (7.5 and 10.0
mL/min) bypassing occurs and both the axial dispersion and the interaction with
a stagnant zone are strong. For high flow rates (12.0 mL/min), the presence of
bypassing is enhanced while the axial dispersion and the interaction with a
stagnant zone are small.
ACKNOWLEDGEMENTS
This research was supported by the CNPq (
REFERENCES
Backer, L. and G. Baron, “Residence time distribution in a packed bed bioreactor containing porous glass particles: influence of the presence of immobilized cells,” J. Chem. Technol. Biotechnol., 59, 297-302 (1994).
Bayraktar, E. and U. Mehmetoglu, “Back mixing and liquid hold-up in
a cocurrent up-flow packed bed bioreactor,” Chem.
Bernardez,
Bernardez,
Callbeck, C.M., X. Dong, I. Chatterjee, A. Agrawal, S.M. Caffrey, C.W. Sensen and G. Voordouw, “Microbial community succession in a bioreactor modeling a souring low-temperature oil reservoir subjected to nitrate injection,” App. Microbiol. Biotechnol., 91, 799-810 (2011).
de Andrade
Iliuta,
Ollivier, B. and M. Magot, Petroleum
Microbiology, ASM Press,
Received: August 19, 2015.
Sent to Subject Editor: December 17, 2015.
Accepted: September 5, 2016.
Recommended by Subject Editor: Mariano Martin Martin